Foothills
Description
Section updated: October 2024
Disclaimer
The Pipeline Profiles interactive maps provide publicly accessible information about CER-regulated pipeline systems. These maps provide information about the pipeline systems we regulate and allow the user to zoom in and view nearby communities and other geographic features.
The information displayed on this map is not meant to be comprehensive, and some datasets have been filtered to show only the most relevant information. Please see the Interactive Pipeline Map to see a more comprehensive picture of CER-regulated pipelines.
This information is also not intended for locating pipelines for construction activities or any other soil disturbance in the area around a pipeline. Please check our Damage Prevention Website for information on where to Click Before you Dig.
Terms of Use
The Canada Energy Regulator (CER) provides this information for personal and non-commercial uses. The information contained in this map is based on externally sourced information. The CER makes no representations regarding the accuracy of this information. The CER accepts no responsibility or liability for inaccuracies, errors or omissions in the data and any loss, damage or costs incurred as a result of using or relying on the map data in any way.
The pipeline data contained in this map is subject to licensing terms and may not be reproduced, published, distributed or transferred in whole or in part. The map also contains information license under the Open Government License - Canada.
The Canadian Energy Regulator is bound by the Official Language Act and relevant Treasury Board policies. However, some material on these pages originates from organizations not subject to the Official Languages Act and is made available on this project page in the language in which it was written.
Sources and Description
Sources
The information contained in these maps is obtained from the following sources: Alberta Energy Regulator (AER) and British Columbia Oil and Gas Commission (BCOGC) (Provincially Regulated Pipelines), CER, from various reports (Western Canadian Sedimentary Basin) U.S. Energy Information Administration (EIA) (U.S. Pipelines); Environmental Systems Research Institute, Inc. (ESRI) (The Community Map of Canada); Geomatics Data Management Inc. (GDM) (CER-regulated pipelines); Government of Canada: Natural Resources Canada, and Surveyor General Branch (Indigenous Lands); Government of Canada: Crown-Indigenous Relations and Northern Affairs Canada (Modern and Historic Treaties).
Description
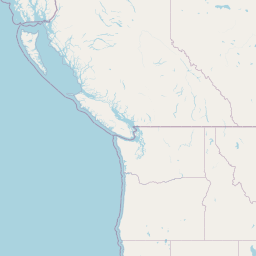
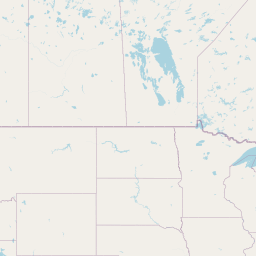
This map shows the foothills pipeline as well as CER-regulated natural gas pipelines, U.S. natural gas pipelines, and provincially-regulated pipelines in British Columbia and Alberta. The Foothills pipeline system has a portion in southeastern British Columbia, from the Crowsnest Pass to the Eastport-Kingsgate Border Crossing. Another segment extends from Alberta and across Saskatchewan to the Canada-U.S. border near Monchy, Saskatchewan.
History
- The Foothills pipeline began operating in 1981.
- The pipeline transports natural gas produced in the Western Canadian Sedimentary Basin to markets in Alberta, British Columbia, and Saskatchewan, as well as the United States.
Supply
- The Western Canada Sedimentary Basin (WCSB) is a vast deposit of hydrocarbons that is approximately 1.4 million square kilometres in size.
- It is the major oil and gas producing region of Canada.
- The Foothills pipeline system transports natural gas produced in the WCSB to markets in Alberta, British Columbia, Saskatchewan, and the U.S.
System Description
- The Foothills pipeline receives natural gas from an interconnect with the NOVA Gas Transmission Ltd. (NGTL) system near Caroline, Alberta.
- At the Canada-U.S. border near Kingsgate, British Columbia, the Foothills pipeline connects with the TC Energy Gas Transmission Northwest (GTN) pipeline. GTN pipeline is regulated by the U.S. Federal Energy Regulatory Commission.
- GTN pipeline transports Western Canada Sedimentary Basin production and supplies markets in the Pacific Northwest, California, and Nevada.
- Throughputs at this location have steadily increased over the last five years. See the Foothills Pipeline Profile or download pipeline throughput and capacity data from Canada’s open government portal.
- At the Canada-U.S. border near Monchy, Saskatchewan, the Foothills pipeline connects with the TC Energy Northern Border pipeline. The Northern Border pipeline is regulated by the U.S. Federal Energy Regulatory Commission.
- Northern Border pipeline transports production from the Western Canada Sedimentary Basin and supplies markets in the midwestern U.S.
Recent Projects
- A number of projects have been proposed on both the Foothills Pipeline System and NGTL System over the last few years as part of the West Path Delivery Program.
- The Foothills West Path Delivery 2022 Project, part of the West Path Delivery Program, was approved in October 2020 [Folder 3930851].
- The Foothills West Path Delivery 2023 Project, part of the West Path Delivery Program, was approved in March 2022 [Folder 4081728].
Reconciliation Content
- We recognize that all lands are the traditional and/or treaty territories of Indigenous Peoples, however, in this data set, only treaty lands are represented due to data availability.
- For more information about how the traditional territories of Indigenous Peoples in a region are defined, it is best to consult First Nation and Metis governments directly.
- For more information about traditional territories and potential or established treaty rights, you may also consult the Aboriginal and Treaty Rights Information System.
Section updated: October 2024
| Pipeline ownership | |
|---|---|
| Pipeline name | Foothills system |
| CER-regulated company | Foothills Pipe Lines Ltd. |
| Parent company | TC Energy Corporation |
| Pipeline attributes | |
| Group for financial regulationFootnote 1 | Group 1 |
| Commenced operations | 1981 |
| Location | The Foothills system starts from Caroline, Alberta and extends southwest to Kingsgate, British Columbia and southeast to Monchy, Saskatchewan. |
| CER-regulated pipeline length (km)Footnote 2 | 1,241 km |
| Transported commodity | Natural gas |
| Pipeline capacity | Capacity on the Foothills pipeline is measured at specific key points. At Monchy, the capacity is approximately 2.2 billion cubic feet per day (Bcf/d). At Kingsgate, the capacity is approximately 2.8 Bcf/d. |
| Major interconnected pipelines | NGTL system, Northern Border pipeline, Gas Transmission Northwest pipeline |
Use
Section updated: November 2024
Throughput and capacity
Section updated quarterly (early March, mid-May, mid-August and mid-November)
Select key point:
Select units:
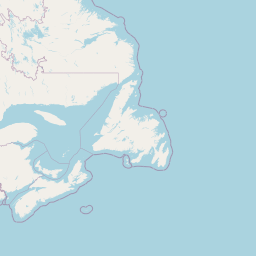
Key Point Map


Key Point Trends
Throughputs at the Kingsgate key point have decreased by 0.1% year over year, from an average of 2.49 Bcf/d in Q3 2023 to an average of 2.49 Bcf/d in Q3 2024 (most recent quarter of data).
Throughputs in Q3 2024 are 10% above the five-year average.
Key Point Description
Interconnect with the Gas Transmission Northwest Pipeline (GTN) at the Canada-U.S. border near Kingsgate, British Columbia. GTN supplies markets in the Pacific Northwest, California and Nevada.
Annual Average Throughput: Kingsgate (Bcf/d)
| 2006 | 2007 | 2008 | 2009 | 2010 | 2011 | 2012 | 2013 | 2014 | 2015 | 2016 | 2017 | 2018 | 2019 | 2020 | 2021 | 2022 | 2023 | 2024 | |
|---|---|---|---|---|---|---|---|---|---|---|---|---|---|---|---|---|---|---|---|
| Export | 1.9 | 2.0 | 1.8 | 1.9 | 1.9 | 1.6 | 1.7 | 1.9 | 1.7 | 1.8 | 2.0 | 2.1 | 2.2 | 2.2 | 2.3 | 2.3 | 2.4 | 2.5 | 2.5 |
Note: The physical capacity of a pipeline is based on many factors such as the products being carried, direction of flow, pipeline pumping capacity, and maintenance work or other pressure restrictions. The actual physical capacity of the pipeline may, at times, be higher than the assumed operational capacity stated here.
Dashboard instructions
- Click on a key point button above the chart & map to view traffic at a different location. The map shows approximate locations on the pipeline where throughputs & capacity are recorded by the pipeline operator.
- Click and drag your mouse on the area chart to zoom into the desired date range. Click on the Reset Zoom button to reset the full date range.
- Click on the chart legend items below the chart to remove & add sections of data as required.
- The key point trends are calculated using quarterly average traffic at the key point. Natural gas throughput trends are displayed year over year (last full quarter of data compared to the same quarter last year). Crude oil and liquids key point trends are displayed quarter over quarter (last full quarter of data compared to the previous quarter).
Note: The five-year average is calculated for natural gas key points using the total throughput across all trade types and direction of flows. For bi-directional key points (both export and import) the throughput is displayed for both directions, instead of the five-year average.
Source and description
Data Source: Open Government
Description: The above dashboard displays pipeline throughput and capacity at key point(s) along the system. Where possible, the five-year average and five-year range for throughput is shown with the current year throughput to better highlight the trends. For pipeline key points with a defined location, a map is displayed next to the graph showing the approximate key point location where pipeline throughput and capacity are recorded.
A conversion of 1 cubic meter = 35.3147 Cubic feet (cf) natural gas is used in this dashboard
Transportation costs (tolls)
Section updated: August 2024
A toll is the price charged by a pipeline company for transportation and other services. Tolls allow pipeline companies to safely operate and maintain pipelines. Tolls also provide funds for companies to recover capital (the money used to build the pipeline), pay debts, and provide a return to investors. The interactive graph below shows the tolls for key paths on the pipeline since 2008.
For tolling purposes, Foothills divides its pipeline system into zones. Zones 6 and 7 are located in Alberta, Zone 8 in British Columbia and Zone 9 in Saskatchewan. Zones 7 and 8 are referred to as the Western Leg segment of the Foothills system, while Zones 6 and 9 are referred to as the Eastern Leg segment.
Foothills calculates tolls for each zone annually based on estimates of the cost of service and throughputs for each zone. Shippers are charged tolls for firm service (applicable to all zones), interruptible service (applicable to Zones 8 and 9), and overrun service (applicable to Zones 6 and 7, when a firm shipper transports natural gas exceeding its contracted amount).
Foothills tolls are regulated on a complaint basis. The tolls are filed with the CER at the end of each year and take effect on January 1 of the following year. This toll filing also includes a list of firm shippers on the Foothills pipeline system (Schedule F, PDF page 20 of 25) [Folder 4163042].
Official CER documents related to the traffic, tolls and tariffs for the Foothills pipeline can be found here: Foothills regulatory documents (tolls and tariffs) [Folder 92840].
Data Source and Description
Data Source: Open Government
Description: The above chart displays tolls data for the pipeline system. Only firm service tolls are shown for illustrative purposes. To see tolls for other service types, see the tariff filing.
Abandonment funding
Section updated: October 2024
The CER requires all pipeline companies to set aside funds to safely cease operation of their pipelines at the end of their useful lives. In 2016, Foothills estimated it would cost $245 million to do this. In 2024, this number was revised to $380 million. These funds are being collected and set aside in a trust. Collection period end date is December 31, 2045.
| 2019 | 2020 | 2021 | 2022 | 2023 | |
|---|---|---|---|---|---|
| Trust fund balance ($) | 48,000,000 | 61,194,000 | 71,700,000 | 72,600,000 | 86,900,000 |
Official CER documents related to abandonment funding can be found here, sorted by year and by company: abandonment funding documents [Folder 3300366].
Financial information
Section updated: October 2024
Foothills operates under a cost of service tolling methodology as negotiated with shippers. Under this methodology the return on equity has remained stable in recent years, while revenue has decreased.
Pipeline companies report important financial information to the CER quarterly or annually. A solid financial position enables companies to maintain their pipeline systems, attract capital to build new infrastructure, and meet the market’s evolving needs. The data in this table comes from Foothills’ Quarterly Surveillance Reports [Folder 155864].
| 2015 | 2016 | 2017 | 2018 | 2019 | 2020 | 2021 | 2022 | 2023 | |
|---|---|---|---|---|---|---|---|---|---|
| Revenue (million $) | 178.9 | 173.4 | 180.7 | 178.4 | 180.6 | 174.5 | 173.4 | 189.2 | 189.6 |
| Operating income (million $) | 24.2 | 20.2 | 18.4 | 16.7 | 17.7 | 17 | 14.8 | 14.6 | 43.8 |
| Net income (million $) | 17.7 | 16.1 | 14.9 | 13.6 | 13.2 | 12.6 | 12.5 | 12.3 | 24.8 |
| Average rate base (million $) | 437.7 | 398.4 | 369.1 | 336.9 | 327.3 | 312.9 | 309.7 | 305.2 | 614.9 |
| Deemed equity ratio (%) | 40 | 40 | 40 | 40 | 40 | 40 | 40 | 40 | 40 |
| ROE (%) | 10.1 | 10.1 | 10.1 | 10.1 | 10.1 | 10.1 | 10.1 | 10.1 | 10.1 |
Disclaimer
The financial information presented in Table 2 reflects regulatory information prepared by each CER-regulated pipeline company and filed quarterly or annually with the CER. This information is filed to inform shippers, the CER and other interested parties on pipeline revenues and expenses and is used in monitoring pipeline transportation costs. Methodologies used in the preparation of this financial information may reflect regulatory decisions and guidance and unique negotiated agreements between a pipeline company and its shippers and interested parties. These methodologies, and the resulting financial information presented, may not follow established accounting principles used in other corporate reporting, and may not be comparable between different CER-regulated companies. For more information, please see the regulatory documents in CER’s REGDOCS and any associated notes contained within them.
Safety and environment
Section updated: November 2024
Section updated quarterly (early March, mid-May, mid-August and mid-November)
-
Conditions compliance
-
Reported incidents
-
Operations and maintenance activities
-
Contaminated sites and remediation
-
Damage prevention regulations contravention reports
Section updated: November 2024
Conditions Compliance
Every pipeline company in Canada must meet federal, provincial or territorial, and local requirements. This includes Acts, Regulations, rules, bylaws, and zoning restrictions. Pipelines are also bound by technical, safety, and environmental standards along with company rules, protocols and management systems. In addition to these requirements, the Commission may add conditions to regulatory instruments that each company must meet. Conditions are project-specific and are designed to protect public and the environment by reducing possible risks identified during the application process.
Condition compliance is part of the CER's oversight and enforcement action is taken when required.
Conditions can be related to a specific region, or apply to the pipeline project as a whole. The map below displays the number of in progress and closed conditions mapped to economic regions as defined by Statistics Canada.
Conditions can typically be either in-progress or closed. The CER follows up on in-progress conditions.
In-Progress
This status refers to conditions that continue to be monitored by the CER. This happens when:
- condition filings have not yet been received by the CER; or,
- filings have been received but are under review or do not yet meet requirements; or,
- a project is not completed and it has conditions, which have not been met; or,
- a project has a post-construction condition, but a requirement has not yet been completed; or,
- some conditions may be active indefinitely or refer to the continued operation of a pipeline.
Closed
This status refers to:
- condition requirements that have been satisfied, and no further submissions from the company are required; or
- conditions whose filings or actions apply to a specific phase that have been fulfilled as the phase is completed (i.e. a specific filing during construction phase). Note: comments on the required actions can still be received.
Dashboard: Foothills System - In Progress Conditions by Region
Some conditions are not tied to a geographic location.
Dashboard instructions
- Click on a region to view conditions info
- Click map area outside of regions to hide info
Note: Some conditions apply to multiple regions. Conditions may be double counted across regions, resulting in a higher number of conditions than the totals seen in the buttons above.
Source and description
Data Source: Open Government
Description: The above map displays the number of CER conditions associated with projects approved by the Commission. The map is split into two tabs which show in-progress and closed conditions separately, mapped to an economic region. If a company has no in-progress conditions specific to an economic region, the dashboard will default to show the closed conditions by region. An additional view is available which contains the number of in-progress and closed conditions that don't have a corresponding economic region in the dataset. The map regions are shaded based on the number of conditions, with lighter coloured regions containing fewer conditions compared to darker colors. Conditions that apply to more than one region are double counted in the map, and these conditions will appear in the map region total and map region breakdown for each applicable region. The condition counts contained in the map navigation buttons represent total conditions without region double counting.
Have you checked out the CER's interactive conditions data visualization? This tool offers a deep dive into the CER's conditions compliance data and process, exploring conditions across all CER regulated companies by keyword, project, and location.

Emergency management
Section updated: March 2025
The CER checks to make sure companies are keeping pipelines safe by doing inspections, in-depth safety audits, and other activities. Yet, even with these precautions, an emergency could still happen. Sound emergency management practices improve public safety and environmental protection outcomes, and provide for more effective emergency response.
The CER holds its regulated companies responsible for anticipating, preventing, mitigating, and managing emergencies of any size or duration. Each company must have an emergency management program that includes detailed emergency procedures manuals to guide its response in an emergency. We oversee the emergency management program of a regulated company’s project for its entire operation.
The CER requires companies to publish information on their emergency management program and their emergency procedures manuals on their websites so Canadians can access them.
To view Foothills’ Emergency Response Plan, go to TransCanada’s Emergency Preparedness website.